Dynamic text is user-built data-driven text that is linked to a discovery. The text uses dynamic PQL functions to obtain and display the required information.
Dynamic text is constructed in the Dynamic Text Editor in Illustrate and then added to presentations and publications. When the presentations and publications are rendered, the dynamic text shows the current data-driven values of the given dynamic functions.
Building Dynamic Text
This task describes how to add a text box and set up a dynamic function that changes its appearance dynamically.
Before you begin
The data used by your dynamic text is retrieved from either a matrix grid created in Discover or a visual area created in Tabulate. You need to ensure this content is saved (and will therefore be available for selection) before you begin this process.
Tip: Using Tabulate data allows you to blend queries from multiple data sources into a single grid, allowing the dynamic text to be based on multiple data sources.
Step 1: Open the Dynamic Text Editor
Dynamic text is configured in the Dynamic Text Editor (purple highlight below):
- Add a text box to the canvas.
- With the text box selected (blue arrow), click Dynamic Text on the Text (Component) ribbon.
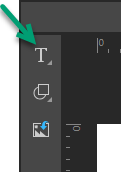
Use the Text control (green arrow below) in the left-hand toolbox.
The Dynamic Text Editor opens at the bottom of the page:
Tip: You can also open the Dynamic Text dropdown list and select Dynamic Text on the submenu (yellow highlight above) to perform the same action. The other item on the dropdown list is Place Holder, which allows you to include placeholder text in your text box.
Step 2: Add Dynamic Text
Creating dynamic text works the same way in Illustrate, Present, and Publish. In all cases, you are defining a variable whose value is pulled from or calculated using the data model. For infographics, the dynamic text will only be replaced once it is embedded in a publication or presentation (at build time for publications and at runtime for presentations).
- Open the Content dropdown list (orange arrow above) and select either the Grid from a discovery or the visual area from a tabulation that you want to base your dynamic formula on.
- Build your dynamic expression in the script editor (blue arrow):
- Use the PQL Functions library (yellow highlight) to add SQL expressions to your script. You can hover over the items in the tree to view details of each function and double-click to copy a function into the script editor.
- Select the relevant cells from the grid to populate the given PQL expressions with data. You can click data cells to add the cell value to your expression or, if your source is a matrix grid, click the label, column header, or row header to add the respective content or total of the column or row values instead.
- Once you are happy with your dynamic expression, you should Test your expression and then click Set to create your dynamic function and close the wizard.
- Check that the name of your Function (supplied at the top of the Dynamic Text panel) is selected as the Actual Value in the Text panel (brown highlight).
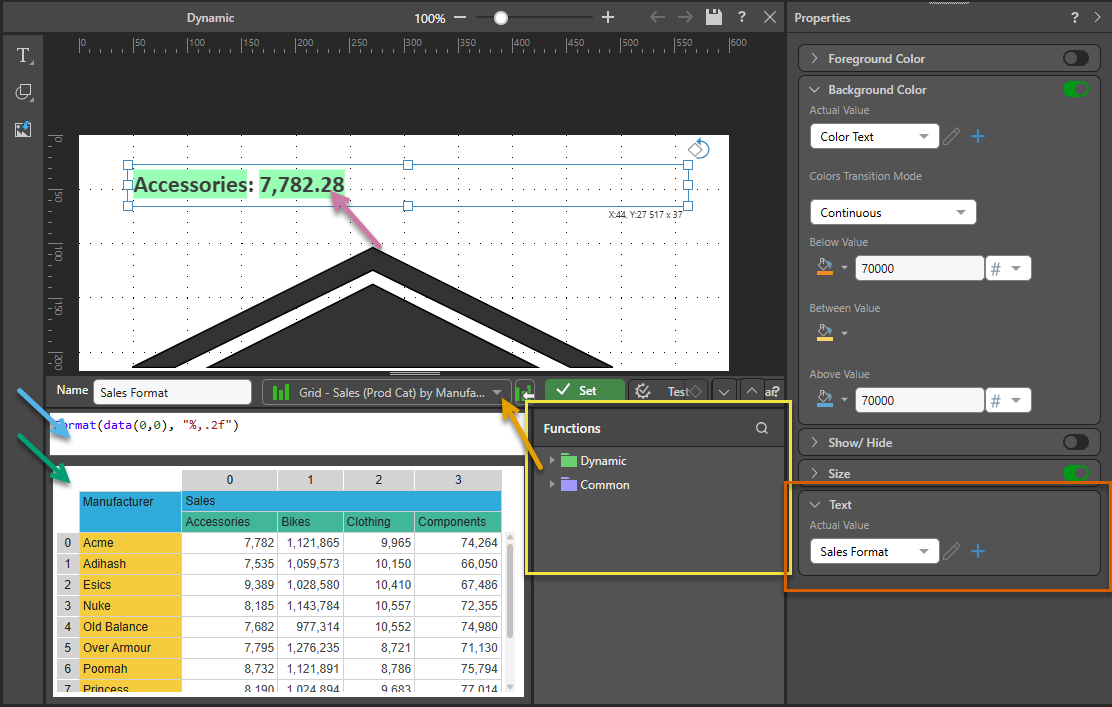
Once selected, the Grid or visual area opens in the editor window (green arrow).
Once you have Set your function, the variable is added to the canvas with a highlighted, green background (purple arrow).
Note: The example above replaces the variable with the selected sales value formatted to two decimal places and applies conditional coloring, changing the background to orange when the value is less than 70,000 and blue otherwise (see Properties).
Dynamic PQL Functions
The Pyramid Query Language (PQL), pronounced "Prequel," is a language built into Pyramid's PYRANA engine to allow users to construct queries that can run against the many SQL data stacks that Pyramid can query natively. PQL includes a vast array of operations and functions that allow users to query data and build analytical logic.
The Dynamic Text Editor exposes Dynamic and Common functions. Dynamic functions are a set of specialized methods that are designed to act on a given query's result set. Common functions are a set of methods that are found in most programmatic and mathematical function libraries. These functions are used to perform logic on basic data without concern for data structures, context, or even source.
To add a PQL function from the library to the script editor, simply double click on it. You will then need to inject values into the function.
Using the LLM AI-Driven PQL Function
Pyramid's Generative AI integration enables you to use AI to generate scripts and images, dynamic text and infographics, calculations and lists, schedules, colors, and more. It allows you to generate a range of content, including complex code, simply by providing a text prompt.
Tip: You can use the LLM PQL function (from the Common PQL functions) to generate dynamic text, adding the results to custom tooltips, text fields, or into your PQL formulas. While this function cannot tell you about your data set, it can add additional information and background to your presentation or publication.
Warning: When using LLMs, your assets are generated using public domain algorithms. This can produce erroneous and inconsistent or random results. Use at your own risk.
Step 3: Set the Dynamic Text Properties
You can set Properties to control whether dynamic text is shown or hidden, and to change its size, rotation, and for the variable text its foreground color, background color, and text properties based on an Actual Value.
To define these behaviors, select the text box or dynamic variable and use the Properties panel to choose the Actual Value and specify the condition that triggers a change.
- Click here to learn about Dynamic Text Properties.
What next?
Once you have set up your illustration, you need to Save it and then use it in one of your publications or presentations.
For details describing how to use your dynamic illustration in a presentation or publication, see:
Examples
Basic Dynamic Text Example
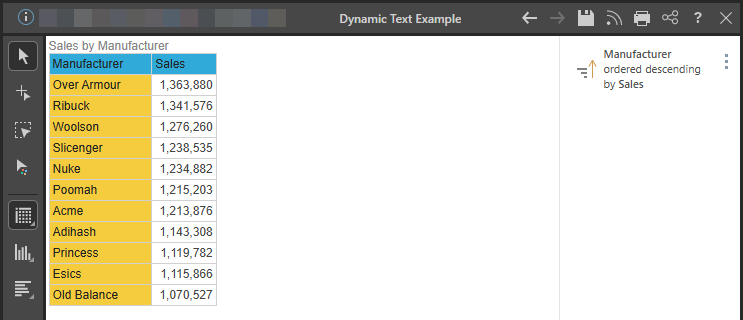
In this example, the dynamic text will be driven by a grid listing sales by manufacturer, in descending order. The text should display the name of the top manufacturer and its sales.
Step 1: Add a Text Box
Add a text box by clicking the text box button, and then doing one of the following:
- Click anywhere on the canvas to drop your field at that location.
- Drag your cursor to draw your field on the canvas. (Use this option to customize the size of your field.)
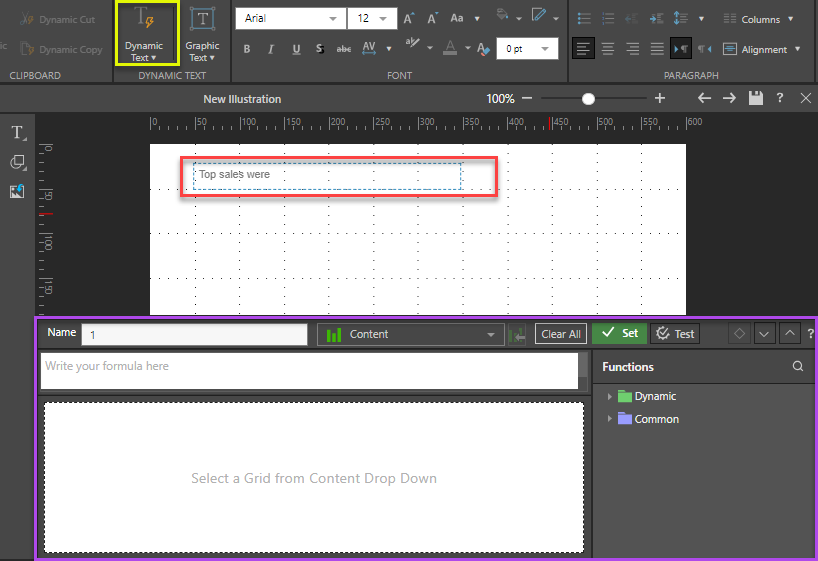
Step 2: Add Static and Dynamic Text
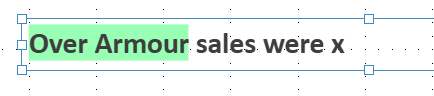
Type your text into the text box. In this example, the text is Manufacturer sales were x; both manufacturer and x will be made dynamic.
After entering the text, highlight the word Manufacturer and click Dynamic Text in the Component ribbon (green highlight below):
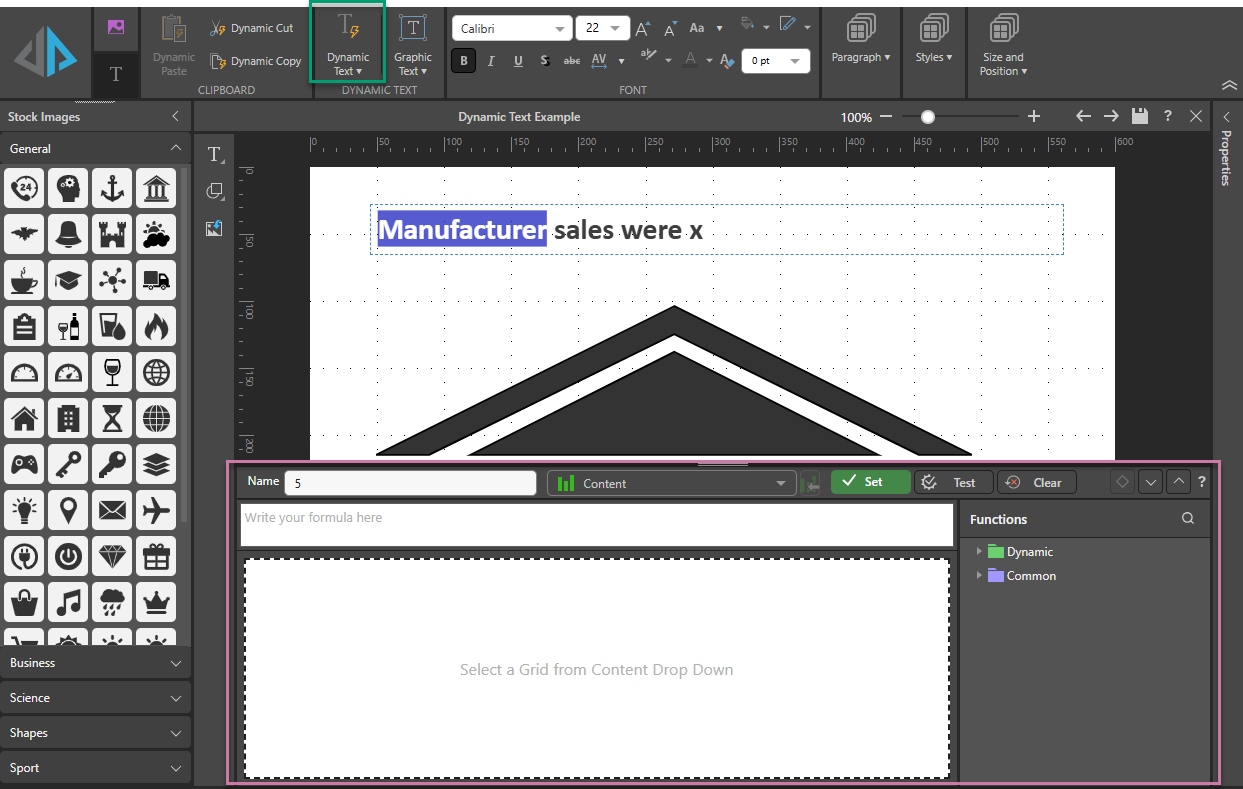
After clicking Dynamic Text, the Dynamic Text Function Editor opens at the bottom of the page (purple highlight above). This is where you'll configure your dynamic text formula.
Step 3: Add Manufacturer Name
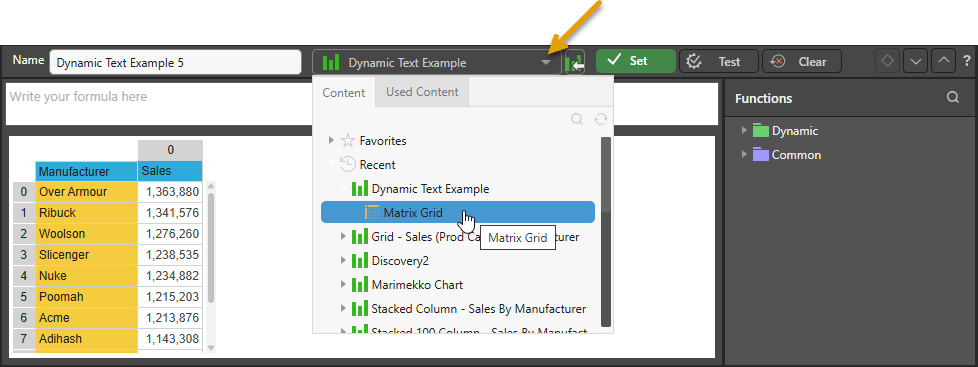
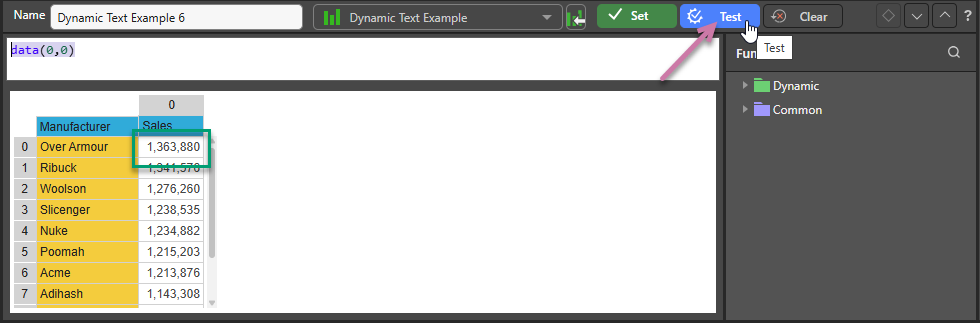
Your dynamic text must be based on an existing grid or tabulation. Open the Content panel (orange arrow) and select the content you want to base your dynamic text on. Once selected, the grid will appear in the editor:
You will create the dynamic text formula by selecting columns, rows, or cells from the columns, and applying functions to the selection from the Functions tree.
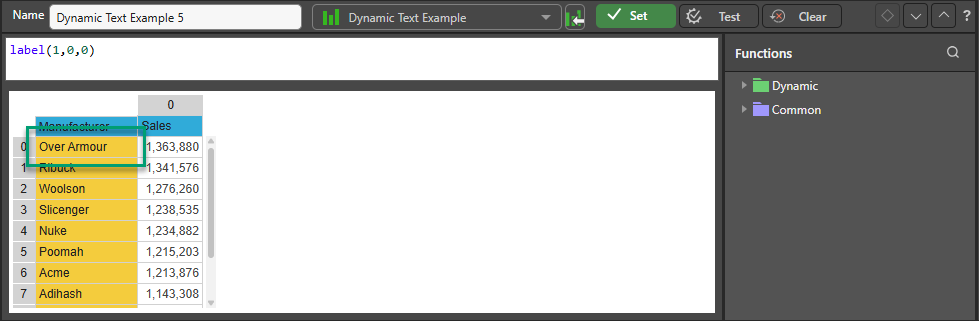
Click the cell that represents the value or element you want to add to your dynamic text.
In this example, this is the cell the top-most label. Once the cell has been added in the next window, click Test to verify your selection or click Apply to confirm your selection and close the editor.
Once applied, the dynamic text will appear in your text box as a highlighted dynamic text variable:
If your statement contains multiple dynamic elements, repeat the preceding steps.
Step 3: Add Sales Value
In this example, the corresponding sales value for the Acme must be added as a dynamic element, so highlight x in the text box and click Dynamic Text again.
Find the same grid in the Content tree, and select the cell containing the sales for the manufacturer whose label you just selected:
Test your selection (purple arrow above).
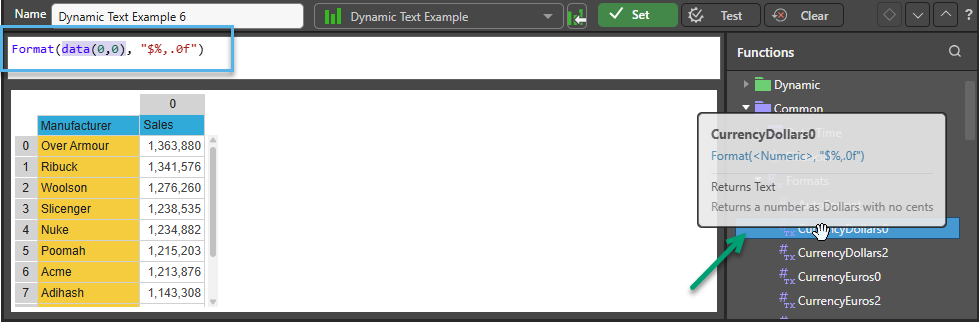
When selecting numeric values, you can specify the format. In this example, the amount returned contains too many decimal places. To reduce the number of decimal places, select the formula (blue highlight below) and apply the CurrencyDollars0 dynamic function (green highlight) from the Functions tree. This changes the formatting to dollars with no decimal places.
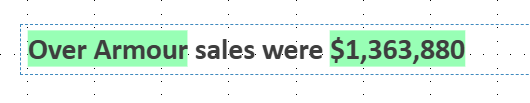
Now, Test the function to see a preview, and then click Apply to confirm the function.
Your dynamic text is displayed in the text box. Save your text for later use in the Present and Publish modules.
Using Tabulate for Multiple Source Grids
Users requiring dynamic text from disparate data based on multiple queries can use Tabulate as the source for dynamic text. Tabulate allows you to blend queries from multiple data sources into a single tabulation. You must then define a Visual Area that can be used as a single data source for the dynamic text. The Visual Area can then be used as a source for the data grid that the dynamic text is based on.
Step 1: Set up a blended tabulation
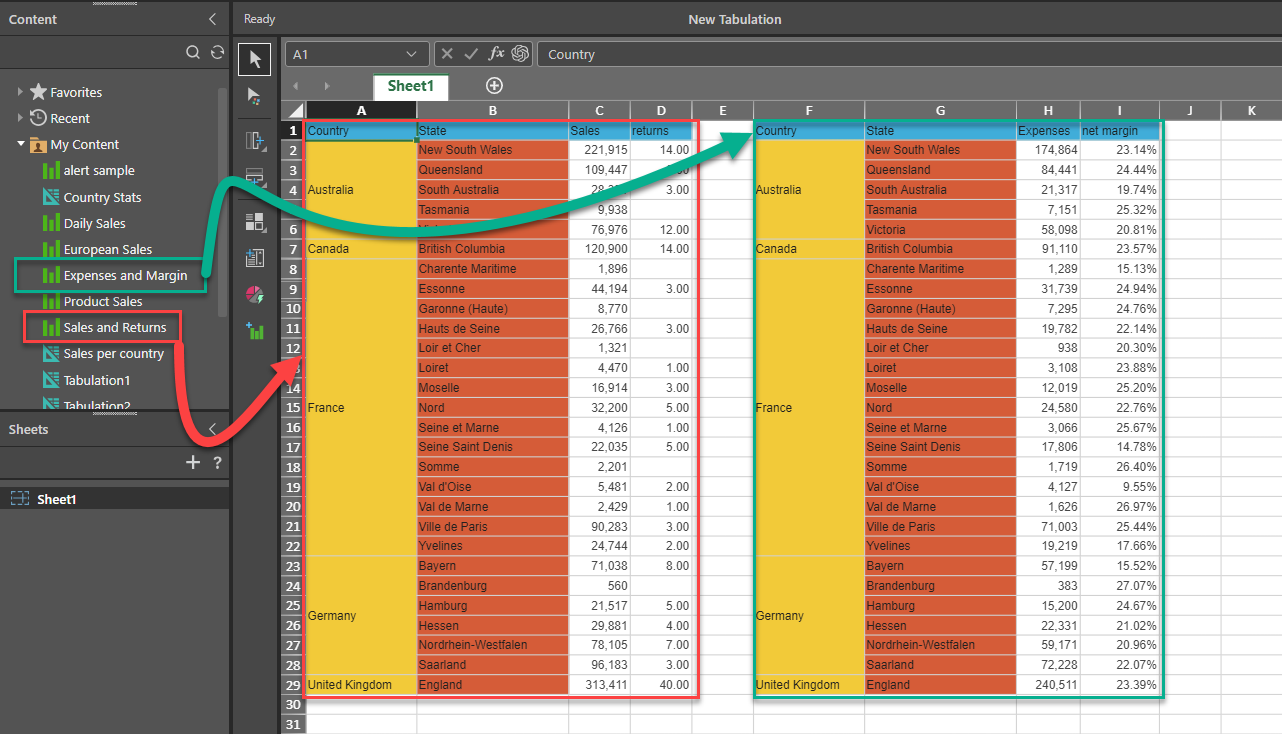
In Tabulate, drag and drop different discoveries onto the canvas. In this example:
- Sales and Returns is dropped onto the left-hand side of the Tabulate canvas.
- Expenses and Margin is dropped to the right-hand side.
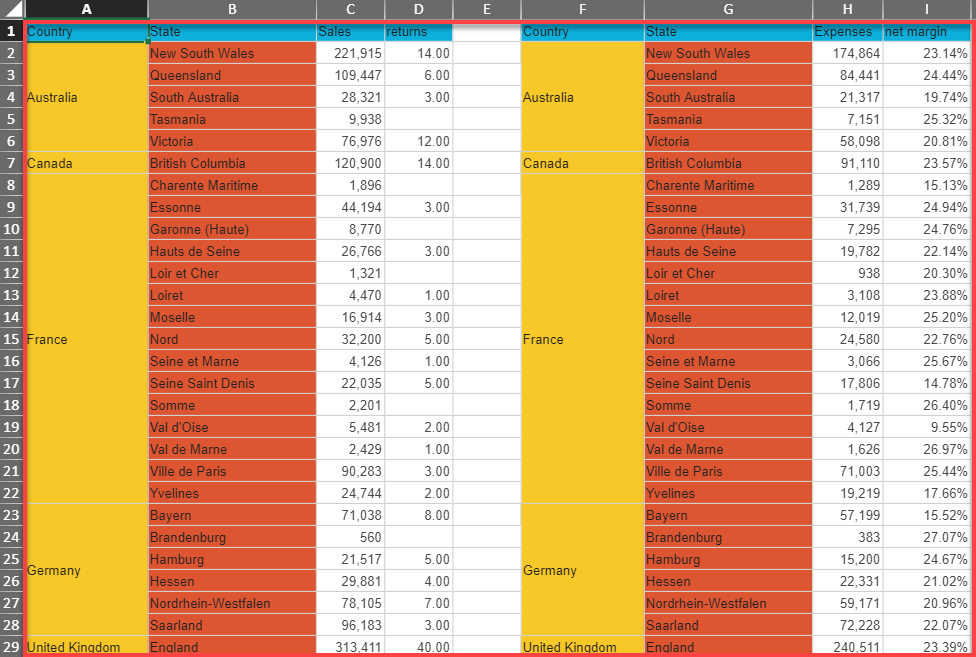
Step 2: Contain everything in a Visual Area
Select the required area including both queries.
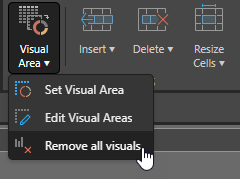
Set the selected content as the Visual Area by first clicking Visual Area > Set Visual Area from the dropdown list on the Tabulate ribbon:
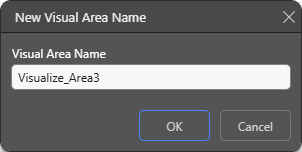
And next, naming the visual area and save the Tabulate worksheet:
Note that you must save the Visual Area in the Tabulation and the Tabulate worksheet in order to use it in an Illustrate item.
- For more information, see Editing Visuals and Visual Areas in Tabulate
Step 4: Select the Visual Area as the Source
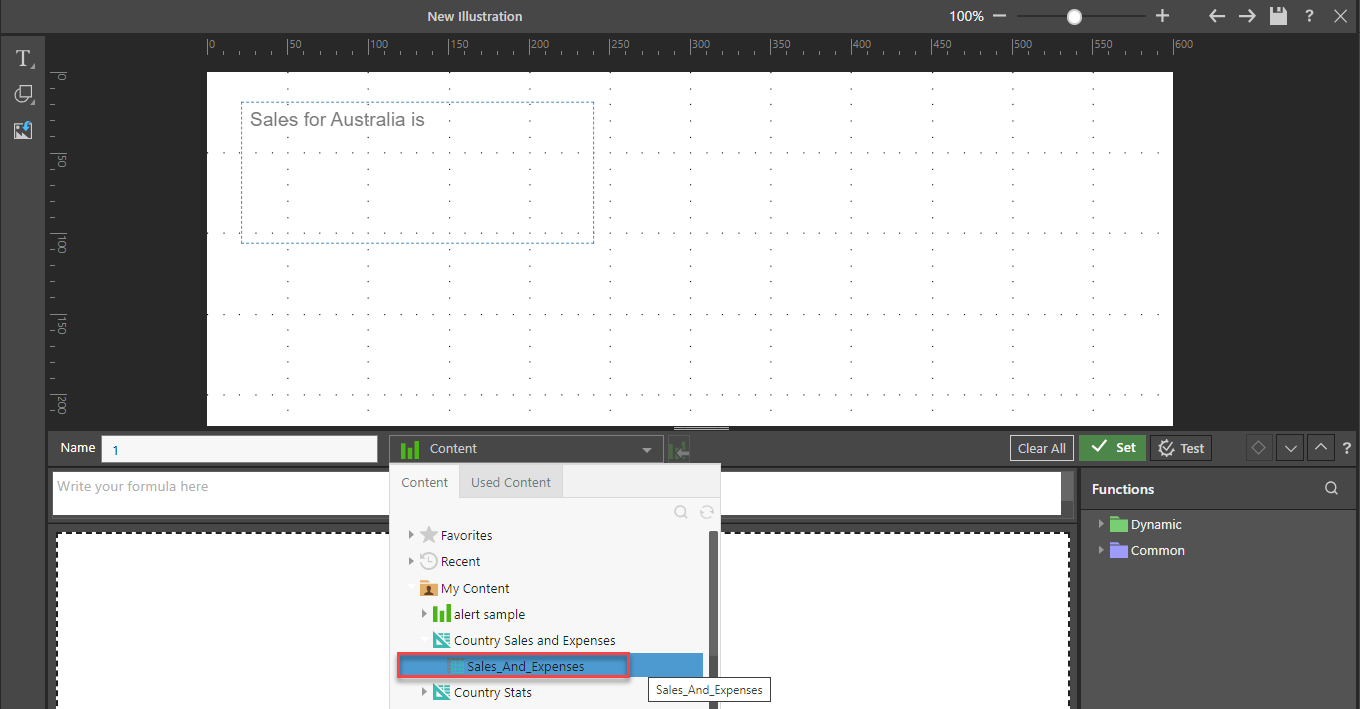
Build your dynamic text (as per the previous example), selecting the Visual Area as the source for the data grid.
From the Content dropdown list, select the Country Sales and Expenses Tabulate item, then select the Visual Area - "Sales_And_Expenses". This will be used as the data grid for the dynamic text.
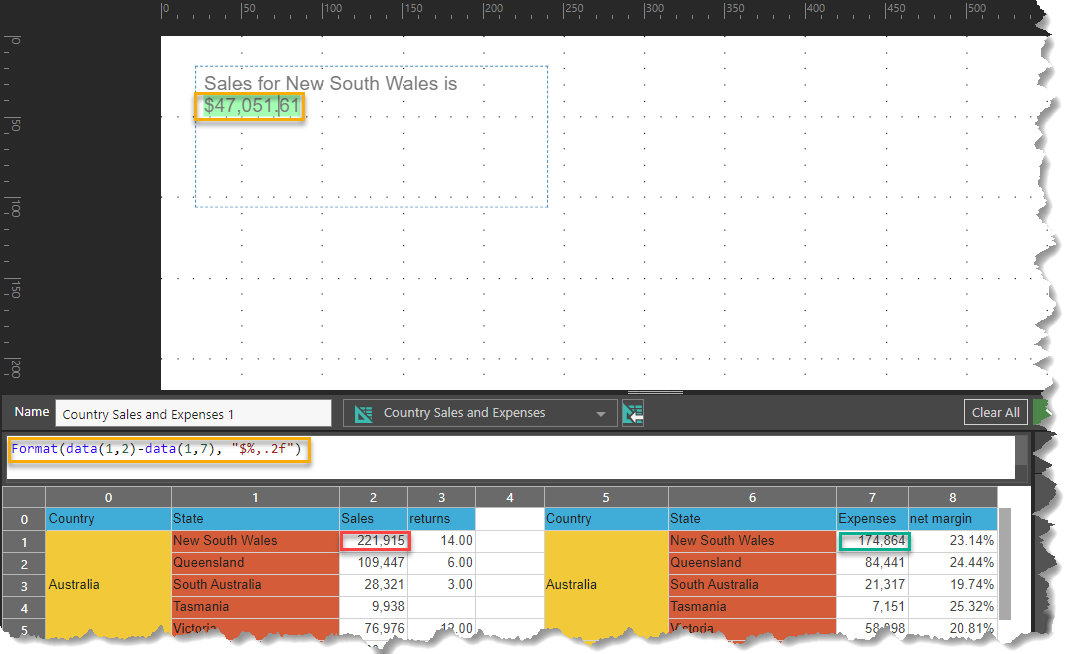
Step 5: Create the Dynamic Text from the Source
You can now use any data from the Visual Area in your dynamic text. In this dynamic text formula (orange box) we have subtracted New South Wales Expenses (green box) from New South Wales sales (red box). The result of $47,051.61 can be seen in the dynamic text (orange box). This demonstrates how data from disparate sources can be used to generate dynamic text.